General Dashboard
The Main SAT Dashboard ([SAT] Security Analysis Tool - Assessment Results) is a comprehensive dashboard with detailed security findings across all categories. It provides a centralized view of your Databricks security posture, enabling you to quickly identify, prioritize, and remediate security issues.
Overview
The SAT dashboard is organized into intuitive sections, each designed to help you quickly assess your security posture across all workspaces. It displays results from SAT's automated security checks, categorized by severity and security pillar.
You can use Databricks One to access and share the SAT dashboards across your organization, making it easier to distribute security insights to stakeholders.
Dashboard Components
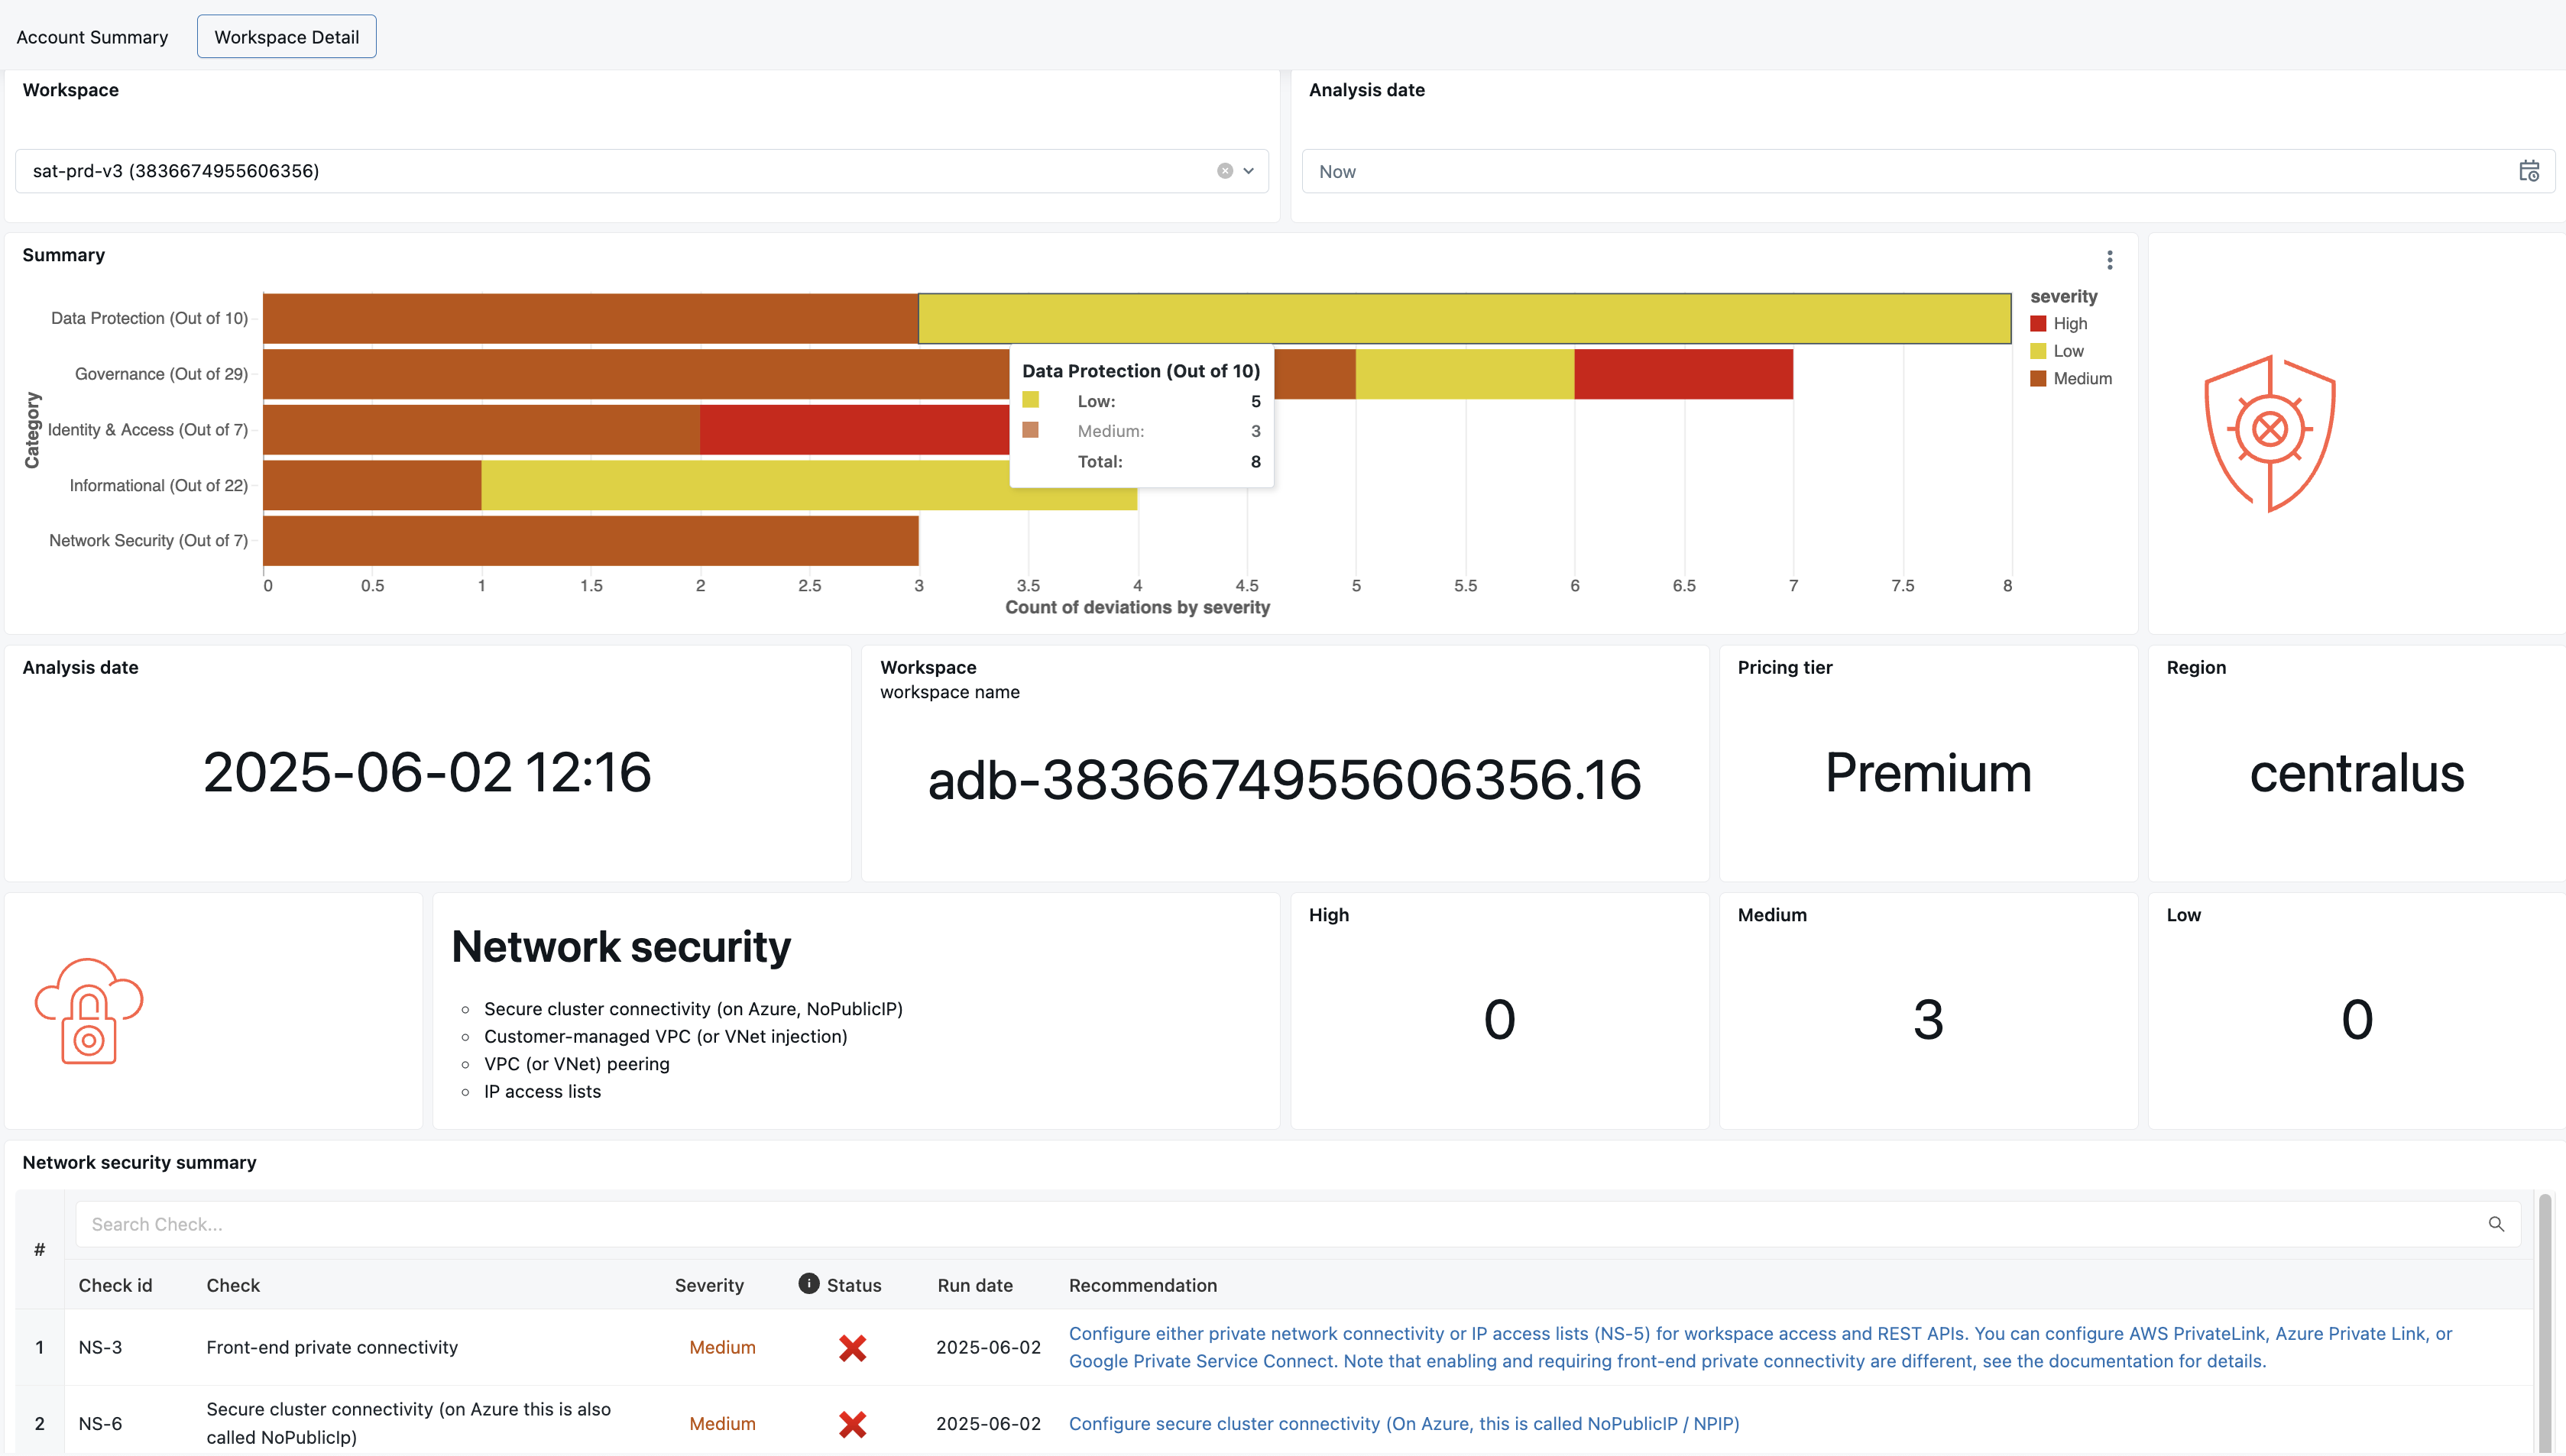
Workspace Security Summary
A high-level overview of security findings, broken down by category and categorized by severity (High, Medium, Low). This provides an at-a-glance view of the overall security health of each workspace.
Displayed Information:
- Summary counts per security category
- Color-coded severity indicators
- Quick comparison across workspaces
Workspace Stats
Displays essential metadata about the analysis run, helping you understand the context of your security findings.
Information included:
- ⏰ Timestamp of the Analysis
- 🏢 Workspace Name
- 💼 Service/Pricing Tier
- 🌍 Cloud Region
Individual Security Category Details
Each of the five security pillars includes comprehensive information to help you understand and address security issues.
What each section includes:
- Summary counts of deviations from security best practices
- Detailed table of security findings, sorted by severity
- Description of each issue
- Links to relevant documentation for remediation guidance
Informational Section
This section highlights observations that are less prescriptive but still valuable for in-depth security reviews.
Purpose: These findings can be reviewed by data and security teams to ensure thresholds and configurations align with organizational policies. Not all informational findings require action, but they provide valuable context for security decision-making.
Additional Finding Details
Provides deep-dive information to help pinpoint the root cause of specific findings, including the logic used to detect each issue.
Example:
If the finding is "Cluster policy not used", the dashboard will list the specific cluster workloads where no policy was applied — eliminating the guesswork and enabling simplified remediation.
Security Categories & Severity Levels
SAT evaluates over 60 security best practices across five key categories, with more being added regularly.
Security Pillars
- 🛡️ Network Security - Network policies, VPC configurations, and network isolation
- 👥 Identity & Access - User management, group memberships, and access controls
- 🔐 Data Protection - Encryption, data classification, and data governance
- ⚖️ Governance - Compliance, audit logging, and policy enforcement
- ℹ️ Informational - Observations and recommendations for continuous improvement
Severity Levels
- 🔴 High - Critical issues requiring immediate attention
- 🟡 Medium - Important issues to address soon
- 🟢 Low - Minor issues for continuous improvement
This structured view helps stakeholders quickly assess risk areas and prioritize remediation efforts across multiple workspaces.
Detection Examples
Let's look at how SAT identifies and presents security findings in practice.
The example below shows how SAT highlights security issues with clear visual indicators and actionable remediation guidance.
Example Finding 1: Deprecated Runtime Versions
🔴 Deprecated Runtime Versions
This check is marked red, indicating that some workloads are using deprecated Databricks runtime versions. While such workloads may continue to run, they will no longer receive support or security patches from Databricks. The Remediation column explains the risk and provides a link to the official documentation listing currently supported runtime versions.
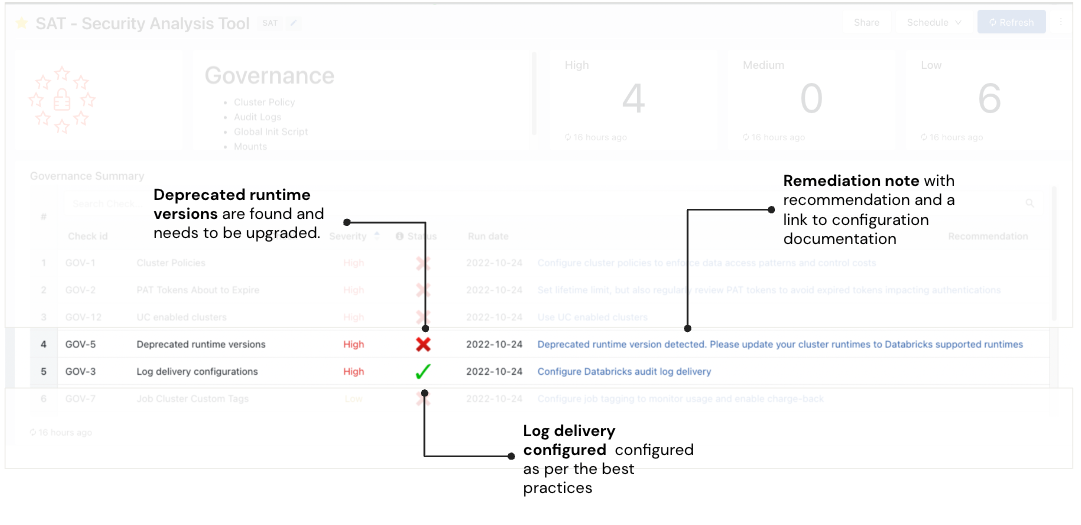
Example Finding 2: Log Delivery
✅ Log Delivery
This check is marked green, confirming that the workspace configuration aligns with Databricks' security best practices for log delivery.
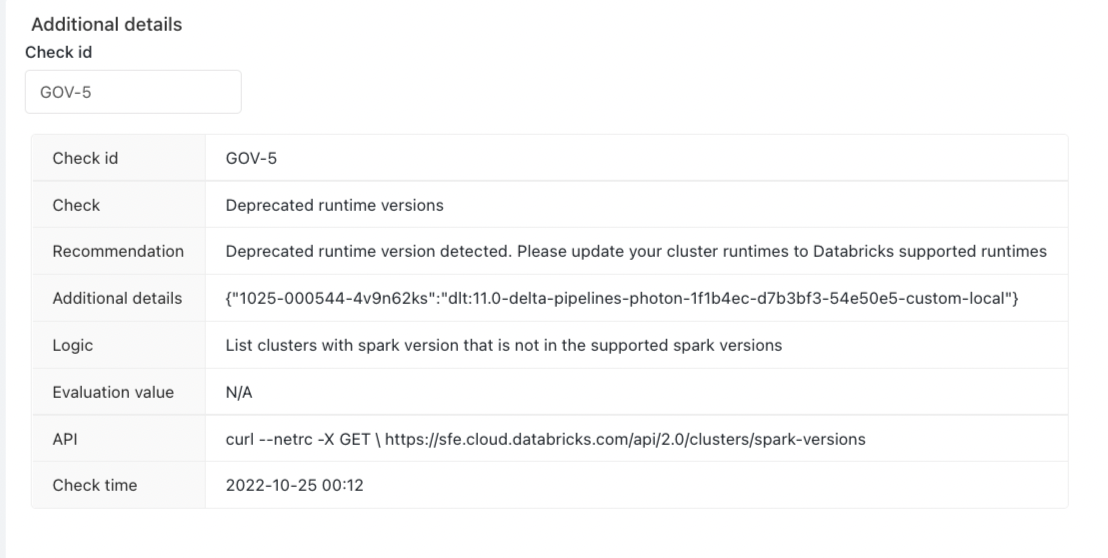
Drilling Down into Details
Customers can use the Additional Details section to view specific configuration settings or controls that caused a best practice check to fail.
Example 1: Deprecated Runtime Versions
The image below shows additional context for this check, allowing administrators to quickly identify and investigate the affected workloads.
Example 2: Log Delivery (GOV-3)
Customers can learn more about the "Log Delivery" check by referencing its identifier, GOV-3.
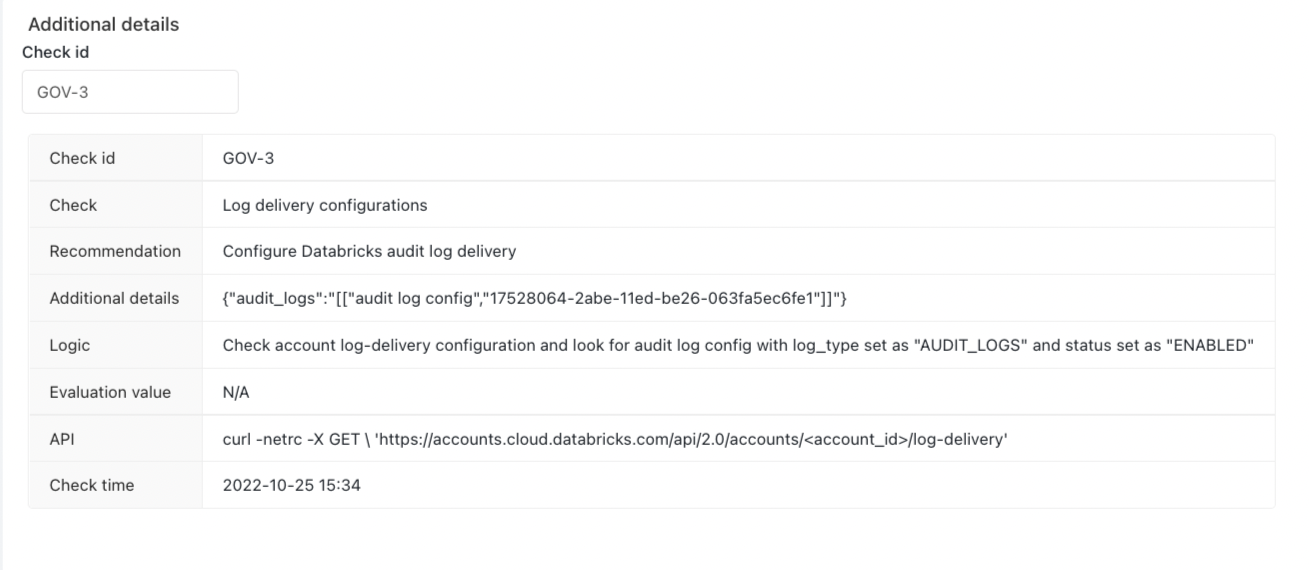
Regularly running SAT checks enables a comprehensive view of your Databricks account and workspace security posture. It also supports continuous improvement by helping you detect and resolve potential security risks early.
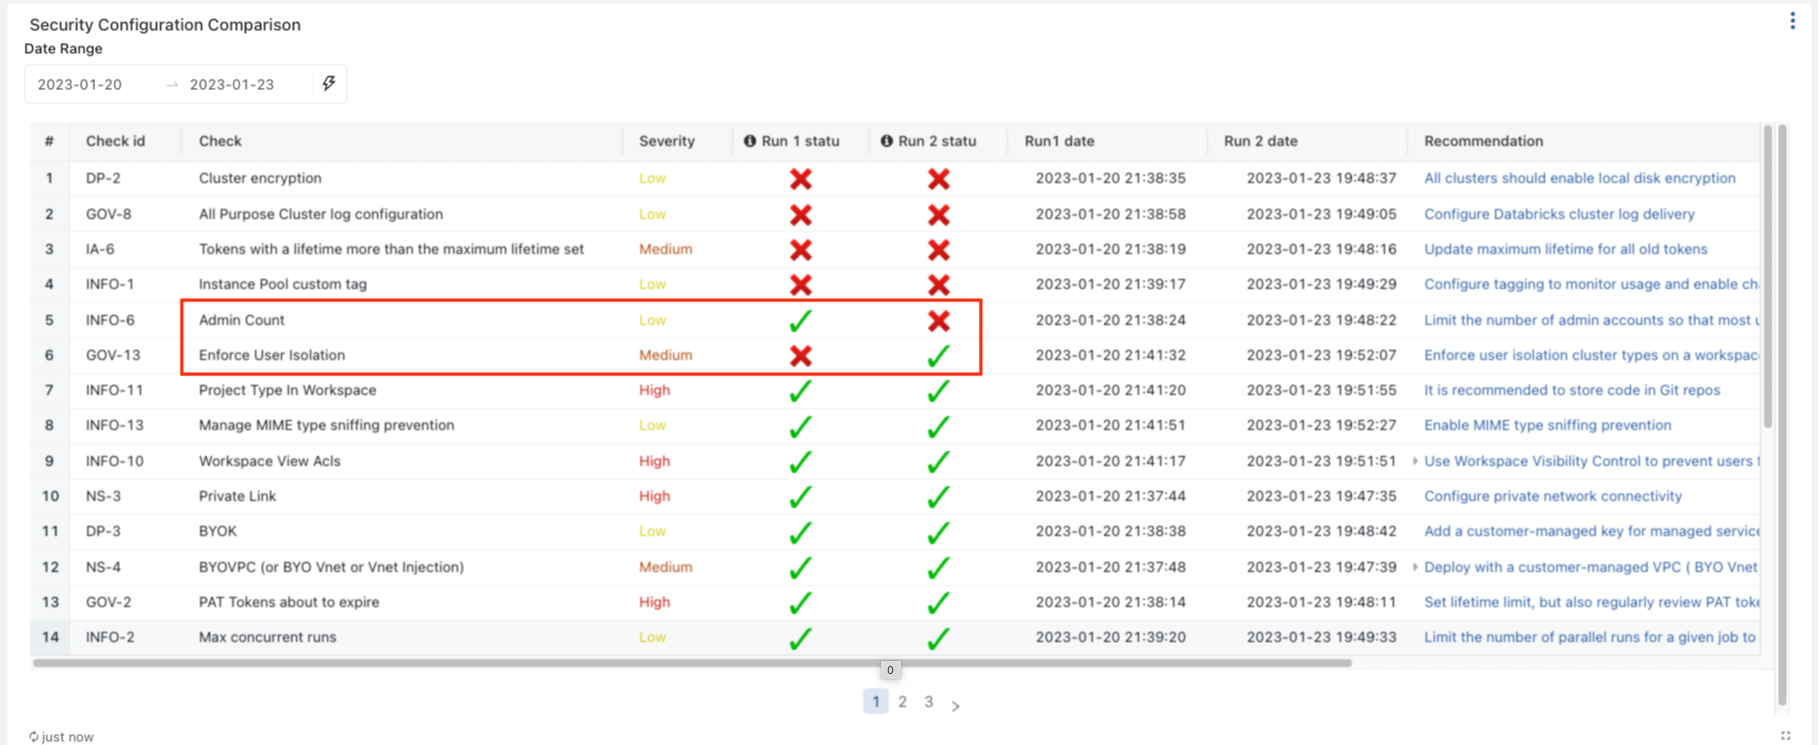
Security Configuration Comparison
This feature enables side-by-side comparison of two SAT runs across all security dimensions, helping you identify improvements and regressions over time.
This drill-down view helps identify which best practice checks have improved or regressed, allowing security teams to take timely action.
What to look for:
✅ Improvements
Cross marks (❌) turning into check marks (✓) reflect better alignment with best practices.
⚠️ Regressions
Check marks (✓) turning into cross marks (❌) signal degradation and should be investigated immediately. Alerts are automatically triggered for critical regressions, notifying relevant stakeholders via email.
Example:
The diagram below highlights changes in individual checks across categories. The red rectangle illustrates an improvement in the "Enforce User Isolation" check, while also showing a regression in the "Admin Count" best practice.
Dashboard Configuration
The dashboards are, by default, owned by the user profile or Service Principal used during SAT setup.
If you encounter errors when running the dashboard, they are most likely due to permissions issues. To update this behavior:
- Click on the dashboard and in the top right, click on the "Share" button.
- Click on the cogwheel icon and select "Assign new owner". Choose the new owner of the dashboard. Ownership can also be assigned to someone with access to the SAT catalog/schema and the underlying tables.
- Click on the "Published" icon next to the name of the dashboard towards the top of the page, and switch to the "Draft" version. Click on the "Publish" button that is next to the "Share" button.
- Choose from one of the two credential options:
- Embed credentials (default): All viewers run queries using the owner's credentials and compute.
This may expose data to users who wouldn't normally have access.
- Don't embed credentials: Each viewer must have access to the workspace and associated data to view the dashboard.
We recommend using this option for more secure access control.
- Embed credentials (default): All viewers run queries using the owner's credentials and compute.
- Choose from one of the two credential options:
- The dashboard can be shared with other team members by clicking the "Share" button from the "Published" mode.
Key Features
The General Dashboard provides:
- 🎯 Prioritized Checks - Checks are organized by severity, enabling focus on high-impact security areas
- 📚 Documentation Links - Each check includes links guiding users to the most up-to-date configuration best practices
- 🔔 Alerting Capabilities - Notifications can be triggered on failed critical checks for immediate attention
- 🔍 Detailed Explanations - Comprehensive failure explanations enable admins to pinpoint, isolate, and remediate issues quickly
Learn More
- Executive Dashboard - High-level view for stakeholders
- Permissions Analysis - Graph-based access analysis
- Cluster Secrets Scanning - Detect exposed credentials
- Usage Guide - Instructions on running SAT workflows