Functionality
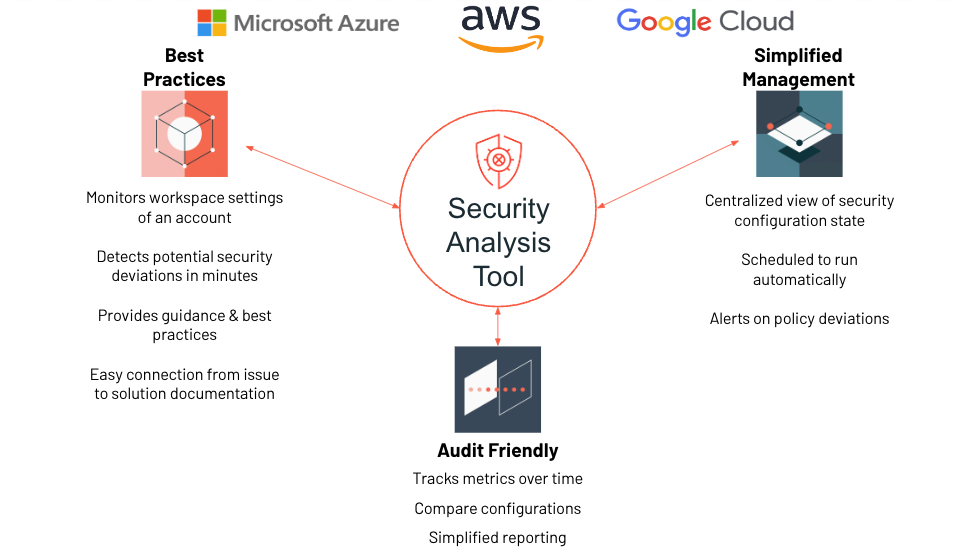
The Security Analysis Tool (SAT) is an observability utility designed to improve the security posture of Databricks deployments. It helps you identify deviations from established security best practices and monitor the security health of your Databricks workspaces.
Running SAT as a routine scan across all workspaces builds confidence â especially when onboarding sensitive datasets and workflows â by ensuring that critical security gaps are addressed proactively.

How SAT Worksâ
SAT is typically run daily as an automated workflow within your environment. Here's what it does:
đ Data Collection
Collects configuration details from Databricks accounts and workspaces via REST APIs.
đž Historical Tracking
Persists results in Delta tables within your storage environment for historical tracking and trend analysis.
đ Centralized Reporting
Displays results in a centralized Databricks SQL dashboard, categorized into five distinct sections to help stakeholders review relevant workspace settings.
Key Featuresâ
đ¯ Prioritized Checks
Checks are organized by severity, enabling focus on high-impact security areas.
đ Documentation Links
Each check includes links guiding users to the most up-to-date configuration best practices.
đ Alerting Capabilities
Notifications can be triggered on failed critical checks for immediate attention.
đ Detailed Explanations
Comprehensive failure explanations enable admins to pinpoint, isolate, and remediate issues quickly.
Security Categories & Severity Levelsâ
SAT evaluates over 60 security best practices across five key categories, with more being added regularly.
Data from all configured workspaces is consolidated and presented through a single-pane SQL Dashboard. All findings are organized into the following categories:
Security Pillars:
- đĄī¸ Network Security
- đĨ Identity & Access
- đ Data Protection
- âī¸ Governance
- âšī¸ Informational
Severity Levels:
- đ´ High - Critical issues requiring immediate attention
- đĄ Medium - Important issues to address soon
- đĸ Low - Minor issues for continuous improvement
This structured view helps stakeholders quickly assess risk areas and prioritize remediation efforts across multiple workspaces.

Dashboard Componentsâ
The SAT dashboard is organized into intuitive sections, each designed to help you quickly assess your security posture across all workspaces.
Detection Exampleâ
Let's look at how SAT identifies and presents security findings in practice.
The example below shows how SAT highlights security issues with clear visual indicators and actionable remediation guidance.
Two findings shown:
đ´ Deprecated Runtime Versions
This check is marked red, indicating that some workloads are using deprecated Databricks runtime versions. While such workloads may continue to run, they will no longer receive support or security patches from Databricks. The Remediation column explains the risk and provides a link to the official documentation listing currently supported runtime versions.
â
Log Delivery
This check is marked green, confirming that the workspace configuration aligns with Databricks' security best practices for log delivery.

Drilling Down into Detailsâ
Customers can use the Additional Details section to view specific configuration settings or controls that caused a best practice check to fail.
Example 1: Deprecated Runtime Versions
The image below shows additional context for this check, allowing administrators to quickly identify and investigate the affected workloads.

Example 2: Log Delivery (GOV-3)
Customers can learn more about the "Log Delivery" check by referencing its identifier, GOV-3.

Regularly running SAT checks enables a comprehensive view of your Databricks account and workspace security posture. It also supports continuous improvement by helping you detect and resolve potential security risks early.
Security Configuration Comparisonâ
This feature enables side-by-side comparison of two SAT runs across all security dimensions, helping you identify improvements and regressions over time.
This drill-down view helps identify which best practice checks have improved or regressed, allowing security teams to take timely action.
What to look for:
â
Improvements
Cross marks (â) turning into check marks (â) reflect better alignment with best practices.
â ī¸ Regressions
Check marks (â) turning into cross marks (â) signal degradation and should be investigated immediately. Alerts are automatically triggered for critical regressions, notifying relevant stakeholders via email.
Example:
The diagram below highlights changes in individual checks across categories. The red rectangle illustrates an improvement in the "Enforce User Isolation" check, while also showing a regression in the "Admin Count" best practice.

Getting Startedâ
SAT must be installed in at least one workspace per Databricks account on AWS or GCP, and in at least one workspace per Azure subscription.
Ready to install SAT?
đ Installation Guides:
- Standard Setup Guide - Manual installation
- Terraform Setup Guide - Infrastructure as Code
đ Usage Guide:
- Usage Guide - Instructions on running workflows, viewing dashboards, and customizing security checks
Executive Dashboardâ
In addition to the comprehensive SAT dashboard, an Executive Dashboard is also provided. This view consolidates key findings from the complete dashboard and presents them in an easy-to-digest format.
What leadership can do:
- â Quickly understand the overall security health of Databricks deployments
- â Identify critical security issues that require immediate attention
- â Track security improvements over time
- â Make informed decisions about security investments and priorities
This executive-level view complements the detailed technical dashboard, ensuring that both technical teams and business stakeholders have access to the security insights they need.

Secret Scanner Dashboardâ
SAT includes a Secret Scanner Dashboard that detects exposed credentials such as API keys, tokens, and passwords across your Databricks Notebooks. This powerful feature helps you quickly identify, prioritize, and remediate secret leaks to keep your Databricks workspaces secure.
Key Features:
đ Comprehensive Detection
- Scans all notebooks across monitored workspaces
- Identifies various types of secrets (API keys, tokens, passwords, custom secrets)
- Provides unique secret counts and total occurrences
⥠Quick Remediation
- Detailed breakdown of secrets by notebook
- Direct notebook path references
- Categorized by secret type for easy prioritization
This dashboard enables security teams to maintain a proactive stance on credential management, ensuring that sensitive information is not inadvertently exposed in notebook code.
